Animated Speedometer / Gauge
Dynamic gauge charts for KPI visualization.
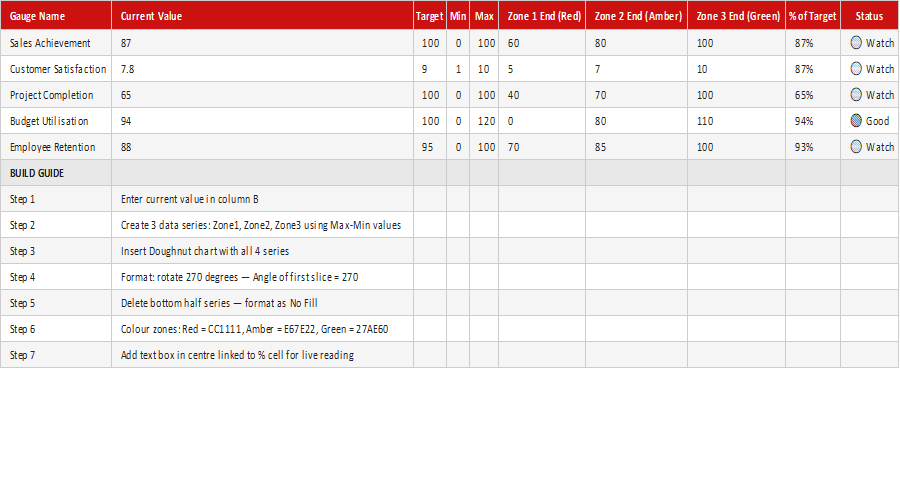
A gauge chart shows progress toward a target in the most intuitive way there is — a needle on a dial. This free Animated Speedometer / Gauge template gives you that, with movement, so a single glance tells the story of performance against target in a presentation or dashboard.
How to use it: set your target and current value and the needle moves to match. Drop it into a dashboard or slide to show KPIs, completion or performance in a way that's instantly understood. Built for Microsoft Excel.
Key features
- Animated speedometer / gauge dial
- Shows progress against a target
- Intuitive single-glance metric
- Great for dashboards and slides
- Built for Microsoft Excel
This template is designed for professionals and teams working in Charts, Dashboards & Analytics who want to manage Animated Excel Sheets tasks efficiently in Microsoft Excel — without the need for expensive specialist software.
The Animated Speedometer / Gauge is part of our Charts, Dashboards & Analytics collection — downloaded 15 times and counting. Built from real-world experience by the ExcelGurukul team and tested across multiple industries and roles.
Frequently asked questions
Is the gauge chart template free?
Yes, free download, no sign-up.
What does a gauge chart show?
Progress or performance against a target, like a speedometer.
How do I set my value?
Enter your target and current value; the needle moves to match.
Does it need add-ins?
No, it's built for Microsoft Excel.