Gantt Chart 001
Gantt chart with task dependencies and milestone tracking.
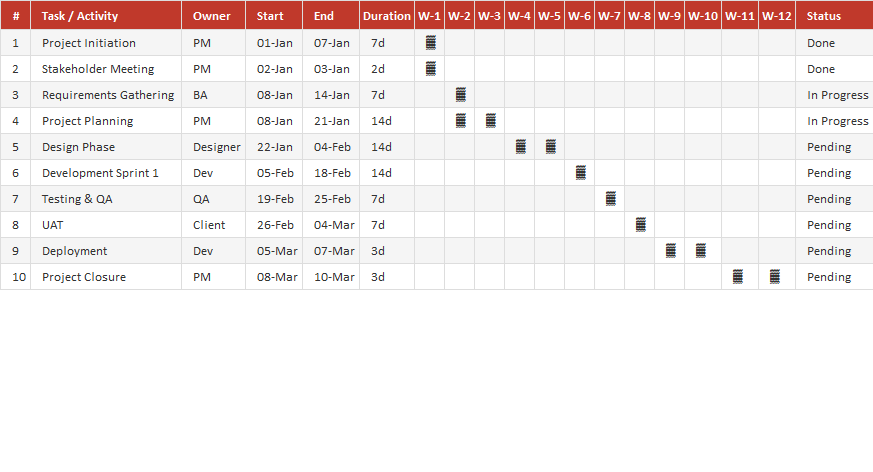
A Gantt chart turns a list of tasks into a timeline you can manage — showing what happens when, what overlaps and what depends on what. This free Excel Gantt chart lets you map your whole project visually, with task dependencies and milestones, so slippages are obvious before they become problems.
How to use it: list your tasks with start dates and durations, link dependencies so the timeline reflects the real sequence, and mark key milestones. As work progresses, update actual dates to see at a glance whether you're ahead or behind.
Key features
- Visual project timeline
- Task dependencies and milestones
- Start, duration and end tracking
- Spot slippage early
- Works in Excel and Google Sheets
This template is designed for professionals and teams working in Project Management ⭐ who want to manage Planning Phase tasks efficiently in Microsoft Excel — without the need for expensive specialist software.
The Gantt Chart 001 is part of our Project Management ⭐ collection — downloaded 15 times and counting. Built from real-world experience by the ExcelGurukul team and tested across multiple industries and roles.
Frequently asked questions
Is this Gantt chart template free?
Yes, free to download with no sign-up.
Does it show task dependencies?
Yes, you can link tasks so the timeline reflects the real sequence.
Do I need Microsoft Project?
No — it's a plain Excel Gantt chart and also works in Google Sheets.
Can I track actual vs planned?
Yes, update actual dates to compare against the plan.