BCG Matrix
Boston Consulting Group matrix for portfolio analysis and strategy.
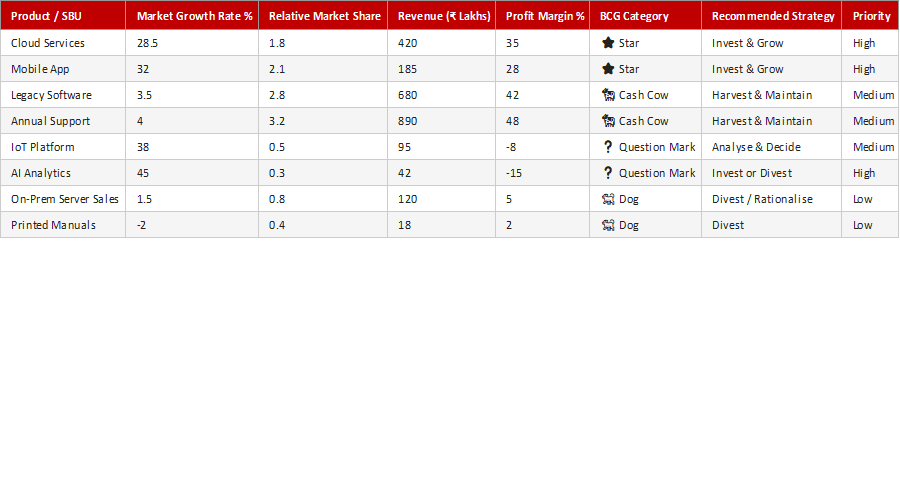
The BCG matrix helps you decide where to invest across a product or business portfolio. This free template plots each offering by market share and growth into the four classic quadrants — Stars, Cash Cows, Question Marks and Dogs — so you can see at a glance what to invest in, milk, question or retire.
How to use it: position each product by its market share and market growth, and the matrix places it in a quadrant. Use the result to allocate resources deliberately — backing Stars, funding from Cash Cows, deciding on Question Marks and phasing out Dogs.
Key features
- Classic four-quadrant BCG matrix
- Plot by share and growth
- Stars, Cash Cows, Question Marks, Dogs
- Guides portfolio investment
- Works in Excel and Google Sheets
This template is designed for professionals and teams working in Business & Operations who want to manage Strategy & Frameworks tasks efficiently in Microsoft Excel — without the need for expensive specialist software.
The BCG Matrix is part of our Business & Operations collection — downloaded 12 times and counting. Built from real-world experience by the ExcelGurukul team and tested across multiple industries and roles.
Frequently asked questions
Is the BCG matrix template free?
Yes, free with no registration.
What is the BCG matrix?
A portfolio tool plotting products by market share and growth.
What are the four quadrants?
Stars, Cash Cows, Question Marks and Dogs.
Is it editable?
Fully editable in Excel or Google Sheets.