KPI Dashboard
RAG-status KPI dashboard with visual indicators for business performance monitoring.
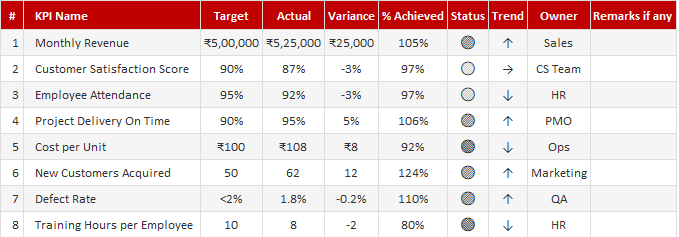
A KPI dashboard turns scattered numbers into a story you can act on. This free Excel KPI Dashboard gives you a ready-made layout with charts and summary cards — just plug in your metrics and targets, and the dashboard visualises performance and trends so you can see at a glance what's on track and what isn't.
How to use it: replace the sample data with your own KPIs, targets and actuals, and the charts and indicators update to match. Use it for monthly reviews, team scorecards or management reporting where a clear visual beats a table of figures.
Key features
- Ready-made KPI dashboard layout
- Charts and summary cards
- Plug in your own metrics and targets
- Visual trends and target tracking
- Built for Microsoft Excel 2016+
This template is designed for professionals and teams working in Charts, Dashboards & Analytics who want to manage Excel Dashboards tasks efficiently in Microsoft Excel — without the need for expensive specialist software.
The KPI Dashboard is part of our Charts, Dashboards & Analytics collection — downloaded 32 times and counting. Built from real-world experience by the ExcelGurukul team and tested across multiple industries and roles.
Frequently asked questions
Is the KPI dashboard free?
Yes, free download with no sign-up.
Do I need to build the charts?
No, the layout and charts are ready — just add your data.
Can I change the KPIs?
Yes, replace the sample metrics with your own.
Which Excel version do I need?
It works best in Microsoft Excel 2016 or later.