Finance Dashboard
Executive finance dashboard with P&L, cash flow and balance sheet.
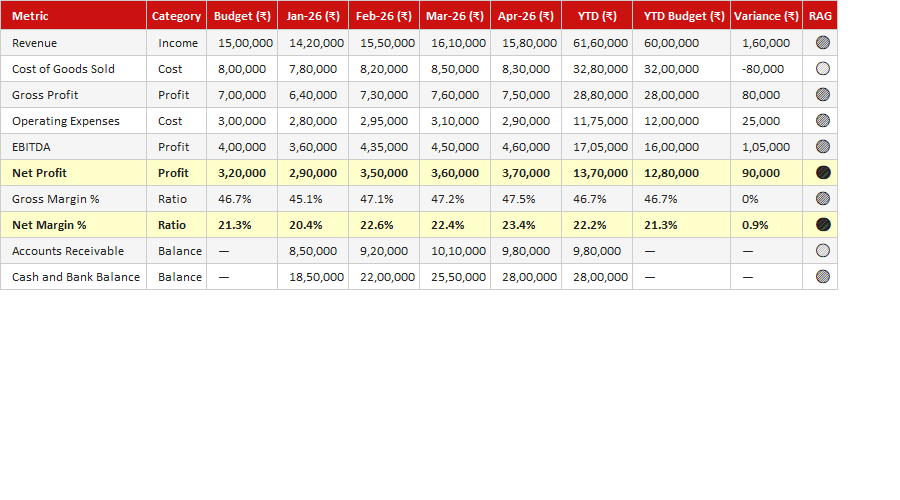
Finance numbers only drive decisions when you can see them clearly. This free Finance Dashboard brings revenue, expenses, profit and cash flow into one visual view, with charts that update from your data — so monthly reviews take minutes and trends are obvious instead of buried in spreadsheets.
How to use it: enter your financial figures by period and the dashboard charts and summaries update automatically. Use it for monthly management reporting, board packs, or simply to keep a clear eye on the health of a business or department.
Key features
- Revenue, expenses, profit and cash-flow view
- Auto-updating charts and summaries
- Monthly and trend reporting
- Clean, board-ready layout
- Built for Microsoft Excel 2016+
This template is designed for professionals and teams working in Charts, Dashboards & Analytics who want to manage Excel Dashboards tasks efficiently in Microsoft Excel — without the need for expensive specialist software.
The Finance Dashboard is part of our Charts, Dashboards & Analytics collection — downloaded 27 times and counting. Built from real-world experience by the ExcelGurukul team and tested across multiple industries and roles.
Frequently asked questions
Is the finance dashboard free?
Yes, free with no registration.
What does it track?
Revenue, expenses, profit and cash flow, visually.
Is it ready to use?
Yes — enter your figures and the charts update.
Which Excel version do I need?
It works best in Microsoft Excel 2016 or later.