Multi-Property Dashboard
Monitor server uptime, incidents and SLA compliance.
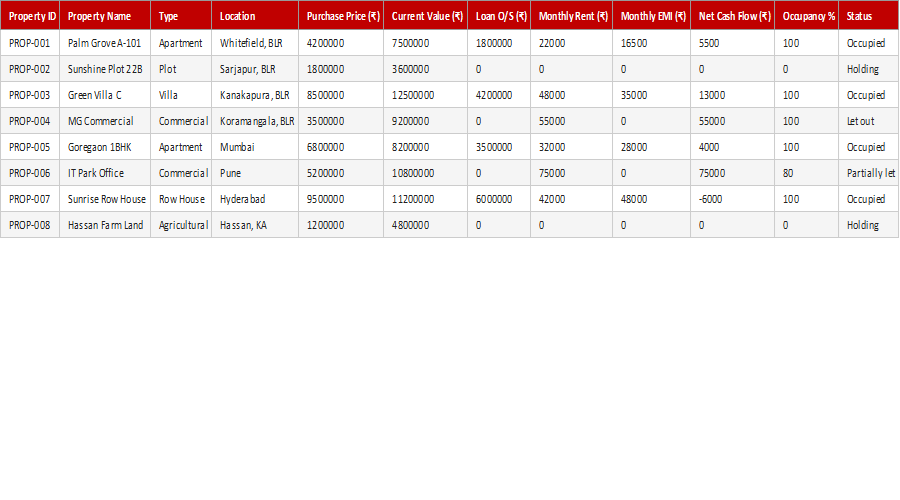
Once you own several properties, you need a portfolio-level view. This free Multi-Property Dashboard brings income, expenses, occupancy and returns across all your properties into one visual summary, so you can see which are performing, which need attention, and how the whole portfolio is doing.
How to use it: enter each property's figures and the dashboard summarises portfolio performance with totals and visuals. Use it for a regular review of your property investments and to spot underperformers quickly.
Key features
- Whole portfolio in one view
- Income, expenses and returns
- Spot underperformers
- Visual performance summary
- Built for Microsoft Excel 2016+
This template is designed for professionals and teams working in Real Estate & Property who want to manage Investment Analysis tasks efficiently in Microsoft Excel — without the need for expensive specialist software.
The Multi-Property Dashboard is part of our Real Estate & Property collection — downloaded 13 times and counting. Built from real-world experience by the ExcelGurukul team and tested across multiple industries and roles.
Frequently asked questions
Is it free?
Yes, free download with no sign-up.
What does it show?
Income, expenses, occupancy and returns across all properties.
Is it ready to use?
Yes — enter your figures and the dashboard updates.
Which Excel version do I need?
It works best in Microsoft Excel 2016 or later.