Sales Pipeline with Weighted Forecast
A sales pipeline tracker in Excel that forecasts revenue by deal stage and probability. Enter each deal's value and likelihood, and the dashboard calculates your weighted forecast, win rate and pipeline value by stage automatically. Built for Microsoft Excel 2016+.
There is also a lightweight version of this template: Sales Pipeline Tracker · Free
This free Sales Pipeline gives you a forecast you can actually trust. Enter each deal's value, stage and probability and the template calculates a weighted value for every opportunity, so your forecast reflects how likely each deal really is to close. Won and lost deals are colour-coded so the live pipeline stays clear.
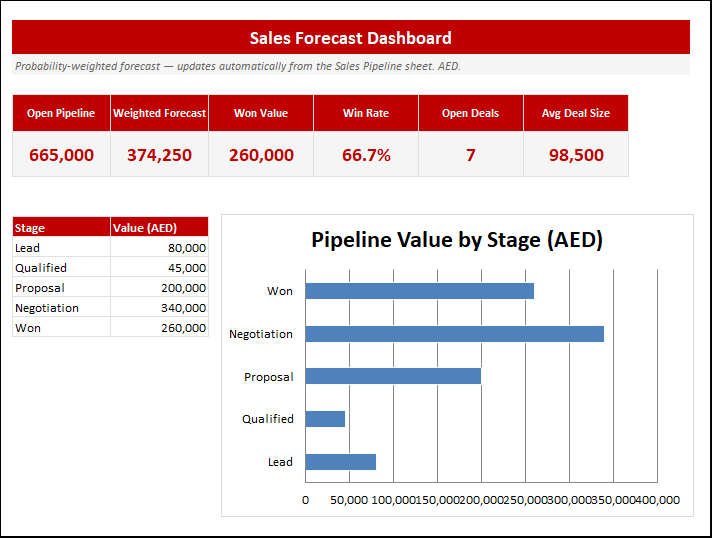
The dashboard rolls it all up: open pipeline value, weighted forecast, won value, win rate, open deal count and average deal size, plus a pipeline-value-by-stage funnel. Built for Microsoft Excel 2016+ and supplied with sample deals, it is ready to forecast straight away.
Key features
- Probability-weighted deal forecast
- Stage-based colour coding
- Open pipeline and weighted forecast
- Win rate and average deal size
- Pipeline value by stage funnel
- Built for Microsoft Excel 2016+
This template is designed for sales managers and business development teams who need to track leads, deals and pipeline revenue in Excel — without the need for expensive specialist software.
The Sales Pipeline with Weighted Forecast is part of our Sales & Marketing collection — downloaded 10 times and counting. Built from real-world experience by the ExcelGurukul team and tested across multiple industries and roles.
Frequently asked questions
Is the sales pipeline free?
Yes, free download, no sign-up.
How is the weighted forecast calculated?
Each deal's value is multiplied by its probability, then summed across open deals.
Does it show win rate?
Yes, win rate and pipeline KPIs update automatically.